English
You are here: Home » Products » Netscout » FLuke OPVXG-EXPT OptiView XG Network Analysis Tablet

Product Category

Contact Us

Tel:  +86-0755-28447806

Phone:  +86-18929367032
Skype:  +86-18929367032
Whatsapp:  +86-18929367032
QQ:  578405965

loading

Share to:
sharethis sharing button

FLuke OPVXG-EXPT OptiView XG Network Analysis Tablet

FLuke OPVXG-EXPT OptiView XG Network Analysis Tablet

The FLuke OptiView XG Network Tablet PC is a comprehensive handheld network analyzer that automatically analyzes the root cause of wired and wireless network issues and application issues, reducing the time spent on troubleshooting.
  • OPVXG-EXPT

  • FLuke

  • factory new

  • 1 year

Availability:
Quantity:

Description

Network Engineer’s tablet with dedicated custom hardwareforautomated network and application analysis in the deployment and troubleshooting of new technologies. It’s at home in the data center with support for 10GbE and virtualized servers; at the users’ office supporting 802.11n and application analysis; and with the switches and routers in between. Use it to find problems from your desk or take it - with the data it has collected - to the trouble spot for first-hand analysis. Its unique troubleshooting system is based on proactive analysis, path analysis, and application-centric analysis, which provides expert guidance that automatically identifies the root cause of problems.

Intuitive user interface with customizable dashboards, smart navigation and easy reporting

User Configurable Dashboards

Present the relevant data to the right audience. OptiView XG has extensively customizable dashboards that help transform collected data into an actionable presentation. The dashboard can be customized to a particular user or for the entire enterprise. Create dashboards for keeping a close eye on network and applications by site or even by business function. These dashboards can be saved and exported to different members of your team. The dashboard provides an at-a-glance overview of the current status of your network, with critical metrics from routers, switches, firewalls, servers, services, application, and other infrastructure devices.

Remote users can also set up dashboards to get their own view of network operations.

Performance Health Checks

Every day, your business depends on a reliable, secure and fast network. Already stretched IT resources are being asked to do more and network maintenance and optimization are often overlooked. The results are unhealthy networks that are improperly utilized, misconfigured and vulnerable to cyber threats.

At-a-glance visibility provided by Health Checks will help you put your critical infrastructure and applications back on track and keep their performance optimized and running smoothly.


Click Image to enlarge

Virtualization Health

Enterprises are virtualizing servers to obtain cost savings and flexibility. Along with the benefits of virtualization comes the new complexity of managing the virtualized network. OptiView XG has built-in capability to analyze Virtual Machines and their host VMware ESX servers. This gives you the capability to quickly track virtual server health at-a-glance and ensure your mission critical applications never fail. OptiView XG’s discovery also gives the capability to find and analyze new virtual machines that are added to ESX host servers.

Quickly check the health of your VMware ESX Server by monitoring CPU, memory utilization, number of virtual machines configured and running, and much more. View VM name, guest OS, and VM state, and detailed virtual machine health statistics including processor, memory, and network usage.


Click Image to enlarge

Network and Application Issue Reporting Engine

OptiView XG offers a number of built-in reports, making it quick and easy to report on application and network problems. These reports help you track performance and utilization statistics. While viewing a screen, pressing the Reports key will generate HTML or PDF reports on Protocols, Top Hosts, Top Conversations, Devices, Networks, Problems and many more.

The intuitive interface facilitates customizing the out-of-the-box reports and also enables creation of completely customized reports using the configurable dashboards in just a few clicks. The ability to choose what data to populate in a report enables users to quickly see data exactly the way they need. You can even create reports for specific user profiles, making it easy to generate reports for specific departments or recipients.


Click Image to enlarge


Automated analysis and guided troubleshooting makes anyone an expert problem-solver

Granular Data for Proactive Analysis

Get granular, real-time data into network and application performance statistics and errors– essential for troubleshooting intermittent and past problems and determining if traffic bursts are the cause of performance problems. This granular data can be gathered proactively and stored for 24 hours so that you can go ‘back in time’ to analyze the data collected when the problem surfaced.


Automated Problem Detection

OptiView™ XG automatically scans for errors in the network infrastructure. These errors are collected in a Problem Log that can be categorized and sorted. Examples of problems detected are: performance problems, duplicate IP addresses, incorrect subnet masks, default router not responding and many more.


Guided Troubleshooting

There are a lot of different errors and problems that can occur on your network and not having the probable cause and resolution readily available increases the time required to solve problems. The built-in “Guided Troubleshooting” engine reduces the time required to identify the root cause and fix the issue, increasing staff efficiency. Clicking on any problem in the problem log immediately shows you the probable cause, potential impacts, and possible solutions for the problem.


Click Image to enlarge


Ensure consistent end user experience and application performance

Application Infrastructure Analysis

Consistent application delivery is critical for business. OptiView™ XG makes it easy to identify and analyze the underlying network infrastructure of an application. This lets you become proactive about application performance issues. It also decreases the time required to isolate network vs. application problems


Path Analysis

Path Analysis helps you understand the exact path taken by the application to quickly resolve application performance issues due to infrastructure. Path Analysis easily identifies the devices that are critical for application performance. With Path Analysis you can monitor all the interfaces that are along the path of the application. It also provides packet loss, delay and response time at each device to identify the device causing any issues.

Path Analysis also enables you to keep a close eye on interface utilization along the path and any other system resources at the server.

Speed up troubleshooting application and network performance issues by automatically validating that network services such as DHCP, and DNS are available and operating correctly, ensuring that server and application connectivity is accessible by opening specific TCP IPv4 and IPv6 ports on servers and reporting the round trip time as a combination of network latency and server connection set up time. Ensure servers are operating efficiently by viewing resources including number of users, processor, memory and disk utilization and services and process that are running.


Click Image to enlarge


Click Image to enlarge

Trace SwitchRoute™

Trace SwitchRoute allows you to see the exact path two devices use to communicate through your switch and router fabric. During Path Analysis, a combination of layer 2 and layer 3 trace routes identifies the entire network path between the application client and the application server, speeding problem isolation. During the discovery, if a switch is discovered in the path, Trace SwitchRoute starts its switch path discovery. The displayed results include the DNS name and IP address, the inter-switch connections by port number, together with link speed and VLAN information. Highlighting any device in the Trace SwitchRoute name column and selecting Device Detail allows you to view that device’s network configuration information.


Click Image to enlarge

Real-time NetFlow finds bandwidth hogs

OptiView XG uses NetFlow to give you valuable insight into bandwidth usage in your enterprise without the complexity and expense involved in a traditional NetFlow analysis setup. The Application Infrastructure Analysis tests in the OptiView XG can collect NetFlow data from flow-enabled routing devices, and uses it to analyze network traffic and report on bandwidth usage across the network. Get instant real-time bandwidth usage reports on top applications, conversations, and hosts using bandwidth, for fast troubleshooting.


Click Image to enlarge

The ONLY tablet with 10 Gbps “On-The-Wire” analysis

OptiView XG provides line rate, real-time application and traffic analysis and troubleshooting on 10/100/1000 Mbps or 10 Gbps links. Identify top talkers, multicasters and broadcasters or select top conversations to determine which hosts may be over-utilizing resource bandwidth. Tap or span key links to determine who is using server bandwidth by viewing top conversations to a single host. Analyze protocol mix to identify top protocols being used and also discover unwanted and custom protocols and see which protocols are being used by each host. These real-time statistics for traffic “on the wire” enable you to understand how network resources are being used and increase user satisfaction with faster response times for networked applications.

OptiView XG automatically discovers all protocols and sub protocols from the MAC layer to the application layer. This enables IT staff to identify applications (including those that use dynamically assigned port numbers) utilizing link bandwidth to see and validate the impact of applications on network resources and also identify illicit applications. Deep packet inspection differentiates between specific audio, video, image, and data applications, and shows the level of bandwidth usage for each.


Click Image to enlarge

VLAN Visibility and Trunk Analysis

Only “on the wire” analyzers can provide vision into actual VLAN trunk traffic. When connected to a switch trunk port, the OptiView XG will detect all VLANs available on that trunk, measure the traffic distribution across all the VLANs and provides the user with the capability of selecting a specific VLAN.

If an individual VLAN is selected, device discovery, traffic statistics and packet capture data will be displayed only for that VLAN.


Click Image to enlarge


Application-centric Analysis

Application issues are difficult to solve and slow performance or outages have serious implications for the business. It is critical to get a view of traffic captures in terms of applications on the network to easily identify bottlenecks. OptiView™ XG provides a comprehensive, high-level overview of the health of applications on your network with easy to use drill down capabilities to gain access to more detailed information.


Full line-rate capture ensures complete analysis

Get 10 Gbps line-rate packet capture and filtering to troubleshoot problems where packet level analysis is required and perform advanced troubleshooting when deploying and analyzing applications.

Sophisticated capture filters allow collection of more relevant data and limit the amount of traffic to analyze by filtering on individual addresses or conversation, IPv4 address range or subnet, or IPv6 prefix and protocols. The capture size can be up to 4GB.

The capture process may be started or stopped through a user defined trigger event – capture the traffic before, after or around an event occurrence without being present. This ensures you capture the event the first time and avoids initiating random traffic captures that may not contain anything of interest. OptiView XG’s unique user interface makes the complex task of setting up filters and triggers as simple as touching the devices or protocols of interest, eliminating errors that result from misconfiguration.


Click Image to enlarge


Free String Match to find and capture anything

Match any set of words or phrases when detected (regardless of the position in the packet – payload or header) in real-time to trigger the OptiView XG to start or stop capturing and/or filter traffic. Use Free String Match to capture traffic around any application error message, detect traffic containing certain words or phrases in non-encrypted emails, web pages, file transfers or documents to identify illicit use of the network or detect downloading of restricted documents based on content or filenames (.doc, .xls, .pdf). Additionally, use Free String Match to identify and track applications that are not allowed on the network such as streaming media that may consume valuable bandwidth, or P2P traffic that may pose a security risk. A total of eight sets of triggers or filters can be defined to trigger a capture unattended for later analysis, allowing analysis when you have time, not when the event occurred.


Click Image to enlarge


Simplified troubleshooting of application problems

Once traffic is captured, launch the Integrated ClearSight™ Analyzer (iCSA) to see an application-centric view of the trace file. Through a simple and intuitive front page, iCSA presents a comprehensive, high-level overview of the health of applications on your network. From that framework, you can drill down to gain access to more detailed information. For example, you can display all the activity for HTTP applications, then drill down to see activities on each server, and further down to the server flow to observe the actual media content of the flow. iCSA also provides time-based analysis providing detailed trending and statistical information for fast analysis of large capture files. This unparalleled level of control and visibility speeds time to application problem resolution and minimizes overall network downtime.


Click Image to enlarge


opvxg_expt_image_10


Shenzhen Importgm Technology Co., Ltd.

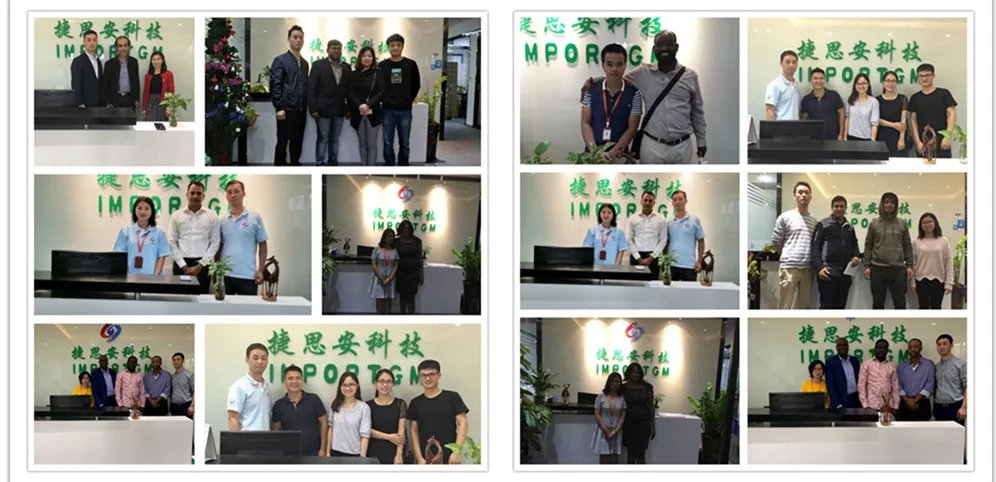
Shenzhen Importgm Technology Co., Ltd. has been operating in the I T services market since 2010,focusing on the R&D, design and sales of core equipment and general accessories in the field of network communications, we are distributors and resellers of worldwide brands of communication equipment, general accessories and system solutions for global customers.We offer a wide range of products, including networking routers, switches, firewalls, servers, I P phones, video conferencing equipment, wireless A P, P D U and modules. We are located in Shenzhen with convenient transportation access. Over the years we have developed a team of highly skilled staff that delivers quality and effective solutions and services. Based on our rich experience, we can supply products with stable packages, reliable delivery, competitive prices and on-time support. Our products are exported to customers in such regions as the Middle East, Africa, America,Europe and Asia. We also welcome O E M and O D M orders.Whether selecting current products from our inventory or seeking engineering assistance for your project bid, you can consult our business staff at any time. Our service does not end when the invoice is printed but begins as soon as you have received your order. Any customers' business visit and negotiation is warmly welcomed. Let's work together and win-win together.

gs图片IMG_8380(1)


客户


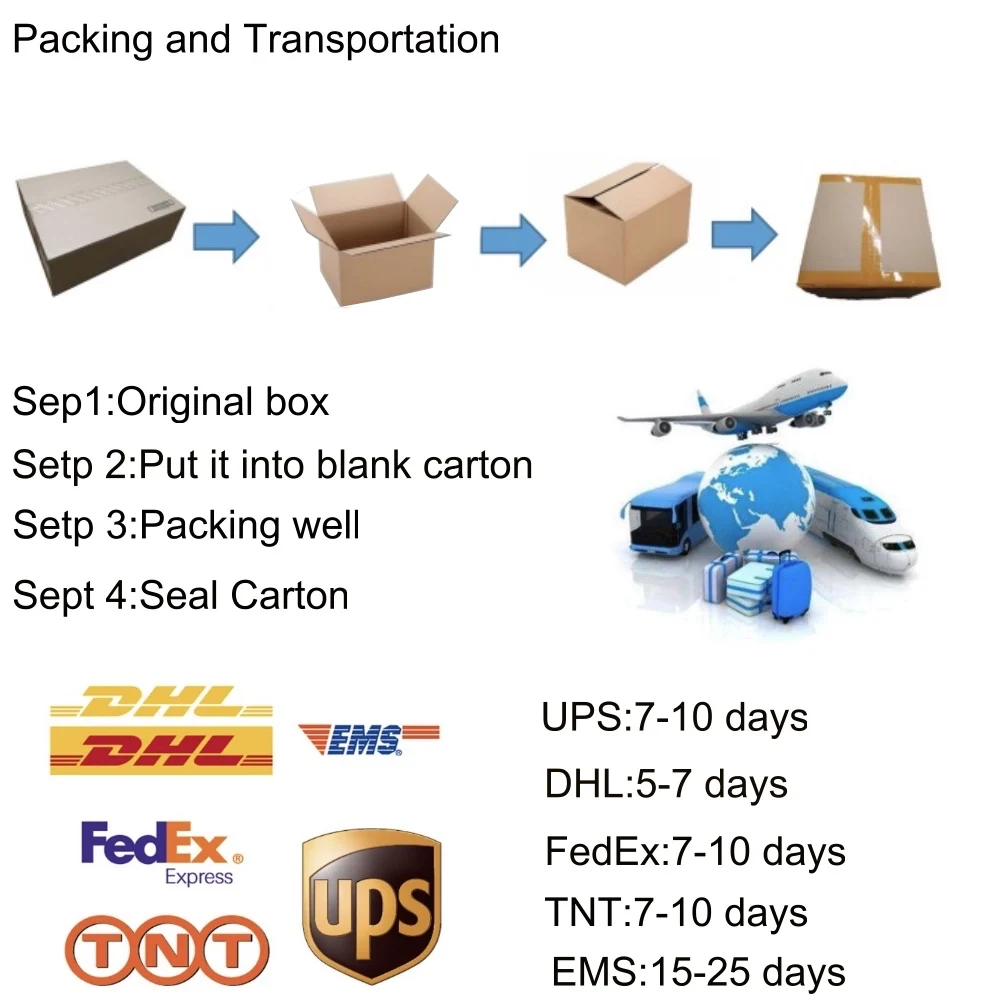
包装

物流


1. who are we?
We are based in Shenzhen,Guangdong, China, start from 2010,sell to Africa(15.00%),Mid East(15.00%),Southeast Asia(10.00%),Eastern Europe(10.00%),South America(9.00%),Northern Europe(5.00%),Central America(5.00%),Western Europe(5.00%),Domestic Market(5.00%),North America(5.00%),Oceania(5.00%),South Asia(3.00%),Southern Europe(3.00%),Eastern Asia(2.00%). There are total about 11-50 people in our office.

2. how can we guarantee quality?
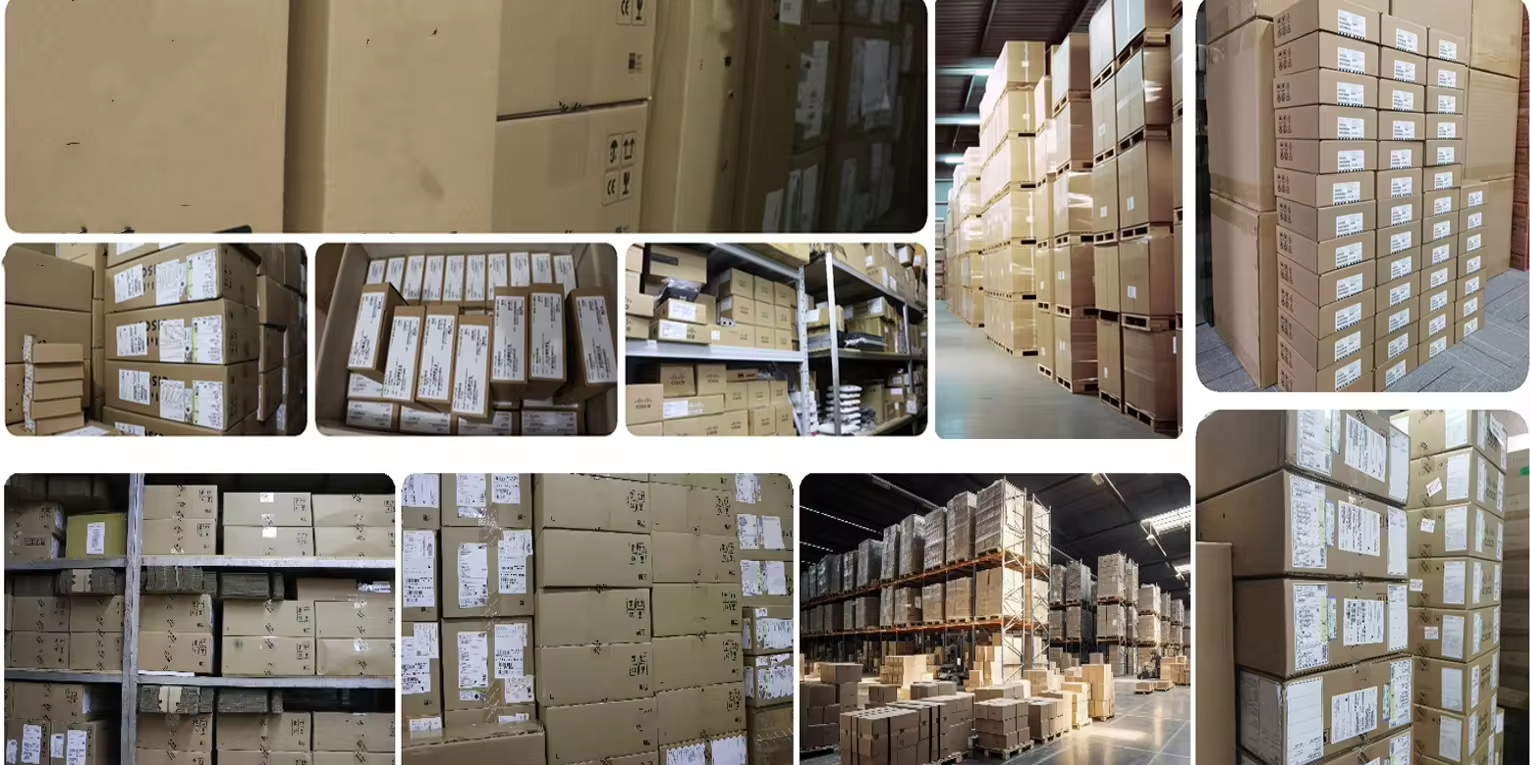
Original brand new products; always pre-final Inspection before shipment;

3.what can you buy from us?
Switches, Routers, Firewalls, IP phones, Servers,Video Conference,AP, PDU,etc.

4. why should you buy from us not from other suppliers?
IMPORTGM has been operating in China for about 15 years. We are one of the largest and complete distributors and resellers of worldwide brands of communication equipment.

5. what services can we provide?
Accepted Delivery Terms: FOB,CFR,CIF,EXW,Express Delivery;
Accepted Payment Currency:USD,EUR,JPY,CAD,AUD,HKD,GBP,CNY,CHF;
Accepted Payment Type: T/T,L/C,MoneyGram,Credit Card,PayPal,Western Union,Cash,Escrow;
Language Spoken:English,Chinese,Spanish,Japanese,Portuguese,German,Arabic,French,Russian,etc.


Previous: 
Next: 

QUICK LINKS

OUR PRODUCTS

CONTACT US

  B609,Bantian International Center, Bantian Street, Longgang District, Shenzhen,China
  +86-0755-28447806
  +86-18929367032
  +86-18929367032
  +86-18929367032
  578405965
FEEDBACK
Copyright  2005-2023 Importgm International limited  All Rights Reserved